Overview
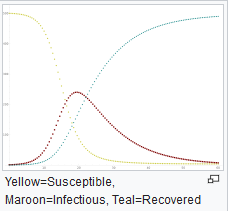
The image should look rather familiar. It is the graph of a standard infectious disease model known as SIR. Understanding a few fundamentals of this model is our final material. The decision to socially distance and its effects can be seen by exploring variations in the SIR model. Websites with interactive models are beginning to appear allowing people to interact with and explore the model visually without having to do any coding. Our goal will be understand how the mathematics guides the behavior.
We will not try to learn deep, deep theory about SIR epidemiology models. Rather we will construct functions using sin(x), cos(x), ex, powers and roots and show how they are consistent with the SIR model, or similar ones. Usually this is just a matter of taking some derivatives of the functions we constructed and showing they are consistent with the model.
Pictures from the writeup in Medium.
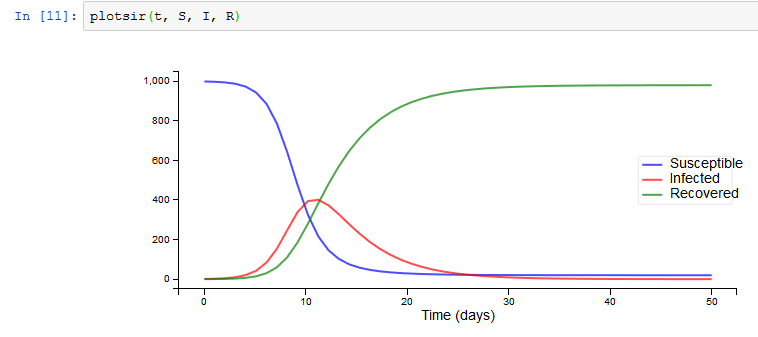
The writeup in Medium had a Jupiter notebook that I used to produce the figures below. (I think the author is a CS major.) Because it is a Jupiter notebook, one can mess with the code, the initial values to see how the model(s) behave. What is here are just pictures. We'll get the interactive version later. (Mathematica will several versions of this.) The author gave a nice explanation, I'll see if I can get access to the article for everyone.
This first one is just a verion of the top figure.
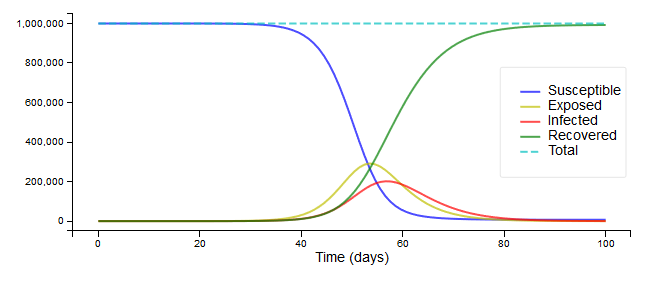
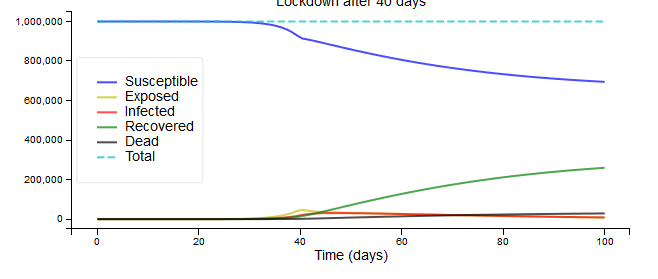
Next, a category of exposed is introduced - they will get sick, but no symptoms yet.
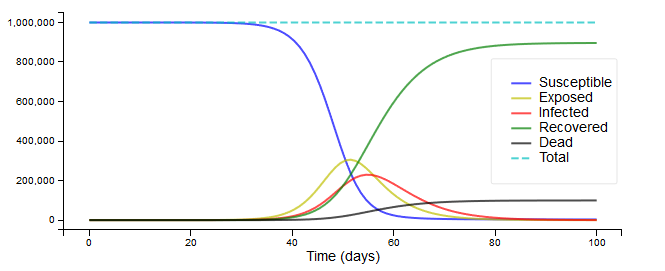
The idea of a Lockdown is introduced. First as a sharp cutoff.
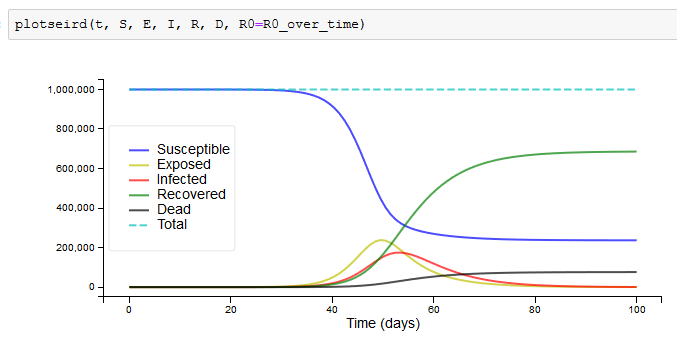
Then as a mild slow Lockdown; the last picture shows how the Lockdown progresses.
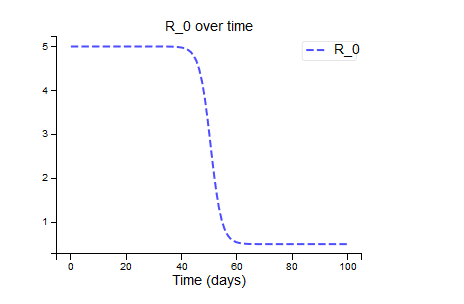
My question to you: what happens if the Lockdown function is not just a cliff, but more like a valley?
(And this is all supposed to be read aloud.)
Background
Equations
Below is a set of equations much like the type you have calculated using implicit differentiation. The setting is this:
\(\bullet\) We have a real variable denoted \(t\), which represents time.
\(\bullet\) We have three functions of \(t\), which are called \(S(t)\), \(I(t)\), and \(R(t)\).
\(\bullet\) These three functions are related. How? The equations below must be true. \[ \begin{align} \frac{dS}{dt} &= -\beta\cdot I\cdot \frac{S}{N} \tag{1} \\ \frac{dI}{dt} &= \beta\cdot I\cdot \frac{S}{N} - \gamma\cdot I \tag{2}\\ \frac{dR}{dt} &= \gamma\cdot I \tag{3} \end{align} \]
-
Next:
- Where do the equations come from? (Short Ans.) Assumptions about how the thing being modelled behaves.
- Questions for a project - How much of a project it is will be flexible.
Related Example 1:
Implicit Differentiation. You saw that the implicit derivative of \(3x^2+y^2=5\) with respect to \(x\) was \( 6x +10 y\cdot y^\prime=0\), which was solved for \(y^\prime\) to yield \(y^\prime=-3x/(5y)\). If we wrote \(\frac{dy}{dx}\) instead of \(y'\) and if we wrote \(y(x)\) instead of \(y\) the expression for \(y'\) would be \begin{equation} \frac{dy}{dx}=-\frac{3x}{5y(x)} \tag{C} \end{equation}
Related Example 2:
\(\sin\) and \(\cos\)
Derivatives. We learned that the derivatives are \(\frac{d}{d\theta}\sin(\theta) =\cos(\theta)\) and \(\frac{d}{d\theta}\cos(\theta) =-\sin(\theta)\).
As Strangers. Let me use some shorthand: \(S(\theta)\) and \(C(\theta)\) for \(\cos(\theta)\) and \(\sin(\theta)\). That is, let \begin{align} S(\theta)\equiv\sin(\theta) \tag{} \\ C(\theta)\equiv\cos(\theta). \tag{} \end{align}The derivatives become \begin{align} \frac{dS}{d\theta}=C(\theta) \tag{A}\\ \frac{dC}{d\theta}=-S(\theta) \tag{B} \end{align}
 wikipedia